Featured Projects Navi Mumbai
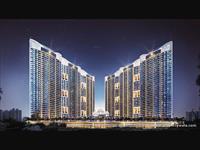 2, 3, 4 BHK Apartments₹ 1.1 Cr - 3.12 Cr
Paradise Sai World Empire
Kharghar, Navi Mumbai
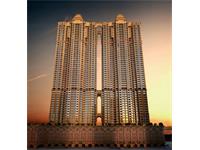 1, 2, 3 BHK Apartments₹ 67.51 L - 2.11 Cr
Arihant Aalishan
Kharghar Sector-2, Navi Mumbai
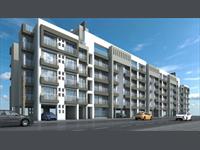 1, 2, 3 BHK Apartments₹ 37 L - 53 L
Arihant Anaika
Taloja, Navi Mumbai
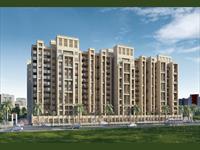 1, 2, 3 BHK Apartments₹ 49 L - 1.35 Cr
Today Oxy Fresh Homes
Kharghar, Navi Mumbai
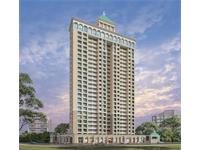 2, 3 BHK Apartments₹ 98 L - 1.5 Cr
Tharwani Palladian
Kharghar, Navi Mumbai
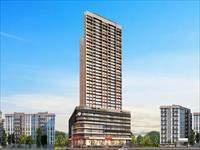 2, 3 BHK Apartments₹ 84.34 L - 1.76 Cr
Bhoomi Serenity
Kharghar Sector-37, Navi Mumbai
Navi Mumbai Property Guide
-

Furnished vs Unfurnished Rental Strategies in Navi Mumbai's Corporate Housing Market
Explore the pros and cons of furnished versus unfurnished rentals in Navi Mumbai's booming corporate housing scene. This article compares rental yields, tenant preferences, maintenance costs, and smart furnishing tactics for various property types and key locations to maximize your investment returns. -

Seasonal Property Price Fluctuations in Navi Mumbai: Best Times to Buy or Sell
Dive into Navi Mumbai's 2025 property market with this guide on quarterly price shifts. Discover peak buying seasons, how monsoons affect deals, festival trends, and smart timing tips for buyers and sellers to maximise gains. -

Unveiling Property Valuation Methods in Navi Mumbai's Planned City Layout
Discover how Navi Mumbai's structured development by CIDCO influences property appraisals, including sector variations, green space impacts, and unique factors differing from organic cities. This guide breaks down key valuation methods for buyers and investors. -

Maximizing ROI Through Property Management Services in Navi Mumbai Rental Market
Explore the ROI of professional property management in Navi Mumbai's vibrant rental scene. This article delves into cost benefits, income strategies, tenant retention, and compares self vs pro management across sectors. Discover how experts boost profits. -

Impact of IT Sector Growth on Residential Demand in Navi Mumbai
Explore how the booming IT sector in Navi Mumbai is reshaping housing demands. This article delves into salary-property price ratios, preferred locations and amenities for tech pros, and forecasts future residential needs driven by job growth. Ideal for buyers and investors eyeing this dynamic market. -

Unlocking Profitable Property Flipping Strategies in Navi Mumbai's High-Growth Micro-Markets
Discover essential strategies for flipping properties in Navi Mumbai's rapidly growing areas. This guide covers identifying renovation-ready homes, analyzing 17.4% price surges, and estimating flip timelines for maximum returns in emerging sectors like Ulwe and Kharghar. -

Co-Living Spaces in Navi Mumbai: Investment Potential and Tenant Demographics Revealed
Dive into the booming co-living trend in Navi Mumbai's IT corridors. This article explores rental yields from managed properties, key tenant demographics, and compares investment returns against traditional rentals in hotspots like Ghansoli and Kopar Khairane. -

Raigad's Rental Market Boom: Top High-Return Locales for Buy-to-Let Investors
Explore Raigad's thriving rental scene, spotlighting areas near IT hubs and transit points that promise strong yields for investors. Learn yield calculations and effective property management tips to maximize returns in this booming market.
Navi Mumbai Real Estate News
-

PM Modi Inaugurates Navi Mumbai International Airport Boosting Regional Real Estate Growth
Prime Minister Narendra Modi has inaugurated the Navi Mumbai International Airport, a key infrastructure milestone. This development promises to enhance connectivity, spur economic growth, and elevate property values in the surrounding areas, attracting investors and homebuyers alike. -

Navi Mumbai Real Estate Market Hits 90,265 Unit Sales with Year-by-Year Breakdown
Anarock's recent analysis highlights Navi Mumbai's robust real estate scene, with 90,265 units sold versus 83,100 launched from 2022 to Q3 2025. The market saw a massive 109% jump in new supply during 2023, followed by a 23% dip in 2024 due to the previous year's high base. This detailed data offers solid insights for investors eyeing trends beyond airport hype. -

Mumbai Residential Market Launches 15,388 Units in Q3 2025 with Navi Mumbai Leading
Mumbai's residential real estate sector showed strong momentum in Q3 2025, launching 15,388 units. Navi Mumbai led with 39% share, while mid-segment housing dominated at 65%. Capital values dipped 8%, but rentals rose slightly. -

CIDCO Raises ₹900 Crore Via Successful Navi Mumbai Plot Auction for Urban Growth
CIDCO has successfully auctioned ten prime plots in Navi Mumbai, fetching nearly ₹900 crore from top developers. The revenue will fund key urban development projects and enhance public amenities, signaling strong investor confidence in the region's real estate market. This move promises improved infrastructure and growth. -

Navi Mumbai Bucks Trend with 12% Growth in New Project Launches in Q3 2025
While Mumbai and Thane experienced declines, Navi Mumbai saw a 12% rise in new real estate projects during Q3 2025, highlighting its resilience amid the broader MMR market slowdown. -

Navi Mumbai Airport Secures 405 Staff Housing Units at Wadhwa Wise City Panvel
NMIAL secures 405 ready-to-move-in flats at Wadhwa Wise City for airport personnel from October 2025, addressing housing demand ahead of September 30 airport launch. Strategic Panvel location offers 20-minute connectivity and robust infrastructure. -

Navi Mumbai International Airport Inauguration Rescheduled to September 30 Amid Infrastructure Gaps
NMIA's inauguration moves to Sept 30, 2025, despite infrastructure gaps. Real estate market surges in Navi Mumbai, but metro and road delays pose challenges. Experts predict short-term property price spikes with long-term growth potential. -
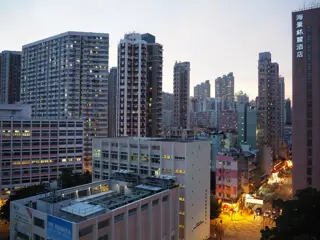
Top 5 Emerging Real Estate Hotspots in Navi Mumbai for 2025 Investors
Navi Mumbai's real estate landscape is transforming rapidly with Ulwe, Panvel, Kharghar Extension, Taloja, and Dronagiri emerging as top investment zones for 2025. Driven by metro connectivity, airport proximity, and infrastructure projects, these areas offer 10-18% annual growth potential.

Buy
With over 100K+ new and resale properties across India, let us help you get you the right property at the right price.
Properties for sale
Rent
PropertyWala can help you easily find a home or office for rent that you'll love from our large database of broker and owner listings.
Properties for rent
Advertise
Advertise your property on PropertyWala and sell or rent it in no time. Advertising your property on PropertyWala is fast and free!
Advertise property FREENavi Mumbai Real Estate
Navi Mumbai: A Dynamic Real Estate Market
Navi Mumbai has become a fascinating and energetic real estate market, offering a mix of affordability, modern infrastructure, and superb connectivity. Here’s a look at the essentials to note when looking for property to buy or rent in Navi Mumbai:
Residential Real Estate
- Affordability: Navi Mumbai is popular for its budget-friendly homes, especially in areas like Kharghar, Ulwe, and Taloja. Government plans like Pradhan Mantri Awas Yojana (PMAY) have increased demand for these affordable homes.
- Luxury Living: For high-end seekers, Seawoods and Palm Beach Road provide luxurious residences with amenities such as pools, gyms, and landscaped gardens.
- Demands and Supply: The residential market is buzzing, with sales often surpassing new launches. Navi Mumbai’s well-organized infrastructure and plenty of green areas make it a top choice for many, causing high absorption rates.
Commercial Real Estate
- Office Spaces: Navi Mumbai is turning into a hotspot for IT and ITES companies, thanks to lower costs compared to Mumbai. Areas like Vashi and Belapur are becoming major business centers with cutting-edge office spaces.
- Retail Expansion: The city is seeing lots of new retail developments, with shopping malls like Seawoods Grand Central and Inorbit Mall reshaping the retail scene. High street shopping in Vashi and Nerul is also rising in popularity.
Infrastructure Development
- Connectivity: Navi Mumbai has prime access to Mumbai and Pune, along with major infrastructure projects. The Navi Mumbai International Airport and the Mumbai Trans Harbour Link (MTHL) promise to greatly improve connectivity and accessibility.
- Public Transport: Extending the metro rail network will offer better transportation options, making commuting more convenient. This will draw more residents and businesses to the area.
Property Prices and Trends
- Price Range: Property prices in Navi Mumbai range significantly, from ₹ 100,000 up to ₹ 1.08 crores on average. The highest prices can reach ₹ 50 crores.
- Growth Potential: Property values in the city are set to rise due to ongoing developments and surging demand. Areas like Kharghar and Kamothe have average property costs from ₹ 11,000 to ₹ 13,000 per square foot.
Quality of Life
- Green Spaces and Amenities: Navi Mumbai is praised for its well-planned infrastructure and green areas that improve residents’ quality of life. Properties here generally come equipped with modern amenities, making the city appealing to families, professionals, and retirees.
PropertyWala's Conclusion
Navi Mumbai stands out for homebuyers and investors alike. With its affordable housing options, thriving commercial sector, and ongoing infrastructure upgrades, the city promises considerable growth. The combination of commercial and residential development, alongside open spaces and green areas, makes Navi Mumbai an excellent option for those looking to invest in the Mumbai Metropolitan Region. Whether you’re searching for a residential home or eyeing commercial investments, Navi Mumbai offers numerous opportunities with great promise for future value growth.
